
ByteOMeter Main Window
Thank you for downloading ByteOMeter! We hope you enjoy using it as much as we enjoyed
making it!
The following is a description of the main window of ByteOMeter, where the current speed readout and graph visualization is happening. The most part of the window is used to represent the network traffic graphically. There are two graphs representing the current download and upload speed respectively. The actual speeds are also displayed in text form in the bottom of the screen with the download speed on the left and upload speed on the right. The speed is shown in kilobytes, megabytes or gigabyte pr. second depending on the actual speed. When scaling the window, the smaller it gets, the smaller the text will get. If the window is big enough, the colour legends of the graphs will be shown next to the up- and download texts.
The window can be dragged around the screen by pressing and holding down the left mouse button over any place of the window area. Double-clicking on the window minimizes it to the system tray on the right. ByteOMeter is still active when minimized and placing the mouse pointer over ByteOMeters system tray icon (see image below) displays a text bubble containing the current up and down speeds.
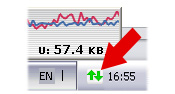
The tray icon
To restore the main ByteOMeter window, simply double-click on the system tray icon. Right-clicking on the main window produces a menu, which is used to access all the other areas of ByteOMeter: Settings, Statistics, Timer, ByteGuard, WebStats and About.
Copyright © 2006, FortaWare- Back to ByteOMeter - The Bandwidth Monitor Homepage